Crop Production Lighting Guide for PAR and DLI Levels

CROP PRODUCTION LIGHTING GUIDE FOR PAR AND DLI LEVELS
To grow heavy yielding and healthy plants, it is important to provide the proper intensity and duration of light. Selecting the correct grow lights, and scheduling the optimal amount of hours per day is crucial to high level crop production. The precise intensity of photosynthetically active radiation (PAR) in the right amount (DLI) hitting the leaves of your crop is necessary for above average yields and product quality.
In commercial greenhouses, different supplementary lighting differs by season. The primary reasons why controlled environment agriculture (CEA), both indoor and greenhouse, manipulate light levels is to adjust for temperature, photoperiod, and irrigation management, optimizing photosynthesis and minimizing crop stress.
Primary and supplemental lighting with LED or High-Intensity Discharge (HID) HPS lamps increase light intensity and duration a crop receives, and thus accelerate growth. On the other hand, retractable shade curtains, light deprivation systems, whitewash, and greenhouse coverings spread out light and reduce light intensity for a more desirable growing environment during periods where light intensity is higher than what the crops need.
Why is Light Important for Crop Production & Plant Development?
Light is an energy form referred to as electromagnetic radiation. Whether from HID lamps or natural sunlight, electromagnetic radiation varies in duration (energy over time), intensity (amount of light at each color or wavelength), and quality (color or wavelength).
Light with a wavelength between 400 and 700 nm is considered photosynthetically active radiation (PAR) - this is the light people can see and most appropriate for crop production. To increase plant metabolism and photosynthesis there needs to be an increasing energy in the PAR range. While each crop species has an optimal light intensity by which photosynthesis will be maximized, we will deal with common ranges and rates. For more data on specific crops, contact the MORR technical team.
The goal of every farm is to provide just enough light - not less or more than required. Growth and crop development should be maximized while plant stress and wasted energy (and spending on electricity) should be mitigated.
How to Measure Light for Crop Production
Since light levels vary throughout the day, a single measurement does not truly represent the amount of light a plant has received, which is why foot-candles and lux, both common units for measuring light in the USA and Europe based on visible light by the human eye, also known as “photometric” units consisting of primarily green light, are not appropriate to measure photosynthesis.
Instead, most horticultural researchers measure light using instantaneous readings in micromoles per square meter per second, o “μmol·m-2·s-1” of PAR. This “quantum” unit quantifies the number of photons (individual particles of energy) used in photosynthesis that fall on a square meter (10.8 square feet) every second. While each measurement also is a single snapshot, this unit is quantified and appropriate for measuring photosynthesis.
What is Daily Light Integral (DLI)?
DLI is the amount of PAR a plant receives each day as a function of light intensity and duration. It is expressed as moles of light (mol) per square meter (m-2) per day (d-1), or: mol·m-2·d-1 (moles per day).
You can think of DLI as a measuring cup collecting throughout the day and reporting back the total amount of PAR received in a day for a specific area. Greenhouse growers often use light meters to measure the number of light photons that accumulate in a square meter over a 24-hour period.
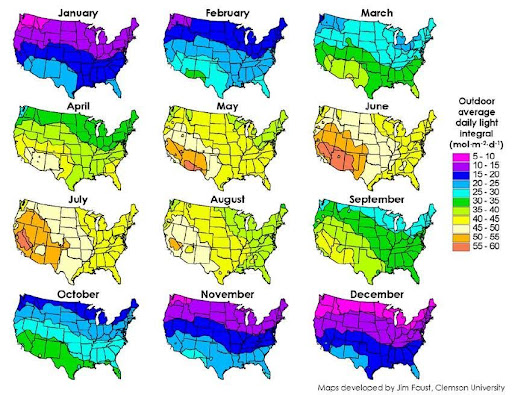
When attempting to understand DLI for specific greenhouse and outdoor farm locations in the United States, growers and researchers rely on this monthly DLI map created by Jim Faust and team at the University of Clemson.
Each figure factors in length of day, time of year, cloud cover, and latitude and how they affect crops in specific areas. By adjusting for these variables, growers are able to get a realistic expectation of what their crops will actually experience. The DLI varies between 5 and 60 mol∙m-2∙d-1 in the map above.
For reference, DLI will rarely exceed 25 mol∙m-2∙d-1 due to glazing, coverings, and coating applied to polycarbonate, poly, or glass; seasonal changes that affect the angle of the earth in relation to the sun’s rays; general shading from hanging objects; cloud cove;, day length; and distance between the roof of the structure and the crop canopy.
Why is DLI Important for Crop Production?
DLI directly influences plant growth, yield, and quality. Getting vine crops to crawl, transplants to root, and branching crops to thicken stems or produce flowers are all somewhat dependent on DLI. Lower than desired DLI will result in more time required to achieve the same growth and development, and time is money to a farmer with a limited season. Higher than required DLI will not only not improve crop yield, but will likely also stunt growth.
One benefit of monitoring light levels is the determination of when supplemental lighting is needed. Another would be when shade curtains should be deployed and retracted. By making these determinations based on data, farms save money and boost efficiency both in operational gains as well as plant growth.
There are many brands of light level monitors, instruments, and logging devices but one such brand that we often rely on is Apogee Instruments. Rather than presenting all product options and how-to-use instructions in this article please visit our website and look for the following options:
- CLOUDBURST WEIGHING PRECIPITATION GAUGE
- GUARDIAN CEA MULTI-SENSOR MONITOR
- PAR, DAILY LIGHT INTEGRAL, AND PHOTOPERIOD METERS
- PYRANOMETERS
- QUANTUM (PAR & EPAR) SENSORS / METERS
- INFRARED RADIOMETERS
- ASPIRATED RADIATION SHIELD
- SPECTRORADIOMETERS
- NET RADIOMETER
- PYRGEOMETERS
- HUMIDITY PROBES
- TEMPERATURE SENSORS
- RADIATION FROST DETECTOR
- OXYGEN SENSORS
- UV SENSORS
- CHLOROPHYLL CONCENTRATION
- BAROMETRIC PRESSURE
- MICROCACHE BLUETOOTH MICRO LOGGER
- RED - FAR-RED AND PAR-FAR SENSORS
- PHOTOMETRIC SENSOR
- NDVI SENSORS
- SOLAR ENERGY PV MONITORING
Using the Apogee Quantum Sensor in conjunction with a computer and data logger is one necessity, in our opinion, for any greenhouse grower. The required spend for the resulting return on investment in data cannot be beaten. It’s like growing during the day, with all the ability to see what you are doing, verses growing in the dark and fumbling around to get the same tasks accomplished.
When is Supplemental Lighting Needed for Greenhouse Crop Production?
When light is limited in duration or intensity, stunted plant growth can present itself. In such situations, it can be beneficial to introduce supplemental greenhouse lighting, either HID (High Pressure Sodium lamps) or LED.
It is important to remember that supplemental lighting is only advantageous financially when increased lighting and photosynthesis will result in greater revenue due to more production in yield, quality, or cycles in each time frame.
When adding supplemental lighting to overcome short days or bad weather, growers can offset the loss in production. Oxnard, Ventura, Carpinteria, and Santa Barbara, CA are amazing locations for crop production but June gloom and an offshore marine layer can cause much of the spring and summer months to have lower than desired DLI. If power is available for supplemental lighting, growers can still produce at peak levels during this portion despite the challenging weather conditions.
Supplemental HID lighting typically provides between 250 and 750 foot-candles which is 33 to 98 μmol·m-2·s-1.
Recommended DLI Levels
The Daily Light Integral (DLI) is one of the most important measurements to observe, log, and rely on when using lighting to optimize crop production. When the DLI drops below optimal levels plant growth and development will be slower and stunted. Yields will be reduced, as will quality. When the DLI is pushed too aggressively, crops show signs of burning, bleaching, withering, and electricity is wasted rather than conserved.
These DLI levels are recommended for most budding crops:
|
VEGETATIVE PHASE |
DLI LEVEL |
|
Seedling |
10-15 |
|
Vegetative |
30-45 |
|
Flowering |
40-51 |
Example of DLI levels for budding crops:
|
WEEK |
DLI (mol/m2/d) |
|
WEEK 1 (Seedling) |
12 |
|
WEEK 2 (Seedling) |
16 |
|
WEEK 3 (Vegetative) |
25 |
|
WEEK 4 (Vegetative) |
38 |
|
WEEK 5 (Vegetative) |
50 |
|
WEEK 6 (Vegetative) |
55 |
|
WEEK 7 (Vegetative) |
31 |
|
WEEK 8 (Flowering) |
35 |
|
WEEK 9 (Flowering) |
38 |
|
WEEK 10 (Flowering) |
42 |
|
WEEK 11 (Flowering) |
45 |
|
WEEK 12 (Flowering) |
48 |
|
WEEK 13 (Flowering) |
50 |
|
WEEK 14 (Finishing) |
45 |
|
WEEK 15 (Finishing) |
40 |
A basic quantum meter can be used to measure the instantaneous photosynthetic photon flux density (PPFD) in micromoles of photons per meter squared per second (µmol m-2 s-1), but ultimately it is the sum total of moles of photons per meter squared per day (mol m-2 d-1) that must be quantified.
Adjusting DLI Levels During the Growth Cycle
DLI is comprised of two variables:
- Intensity (PAR/PPFD)
- Duration (Time with lights on)
Achieving optimal light intensity and duration requires adjusting and playing with both of these variables to dial in your specific cultivation facility, crop, and strain.
What is the Proper Daylight Period?
Maintaining the proper quantity of light on the crop steers it through the seedling, vegetative, flowering, and finishing stages of development. Plants that respond to light and dark environmental conditions can be pushed toward vegetative growth or generative growth by altering the photoperiod.
Hours of light for budding crops:
|
GROWTH PHASE |
MINIMUM |
RECOMMENDED |
MAXIMUM |
|
Seedling |
16 Hours |
18 Hours |
24 Hours |
|
Vegetative |
16 Hours |
18 Hours |
24 Hours |
|
Flowering |
10 Hours |
12 Hours |
14 Hours |
RECOMMENDED PAR/PPFD LEVELS FOR CROP PRODUCTION
Not all crops benefit from the same light intensity but here are some general guidelines for budding plants:
|
GROWTH PHASE |
PAR/PPFD LEVEL |
|
Seedling |
100-300 |
|
Vegetative |
250-600 |
|
Flowering |
500-1050 |
PAR levels are measured in Photosynthetic Photon Flux Density (PPFD) as µmol/m²/s.
The Interplay Between DLI and Co2
In addition to the lighting, temperature, and irrigation - CO2 plays a factor in the growth cycle. Additional CO2 generation is sometimes required to raise yields in controlled environment agriculture (CEA). Indoor farming CO2 levels are generally between 400 and 600 ppm. Plants need anywhere between 400 - 1400 ppm, which means some crops may experience restricted growth unless CO2 is added into the environment. Therefore, it is crucial to supply CO2 at higher levels to boost photosynthetic activity and allow for higher PAR levels and thus higher PPFD.
Recommended CO2 levels for boosting crop production in budding crops:
|
GROWTH PHASE |
CO2 Level (PPM) |
|
Seedling |
400 ppm |
|
Vegetative |
400-800 ppm |
|
Flowering |
800-1400 ppm |
What is Too Much Light for Plants?
Yellow leaves with green stems and veins are indicative of excessive light. Light burn, also known as leaf burn, is often mistaken for fertilizer deficiencies but is a tell-tale sign your crops are receiving too much light - whether in duration or intensity.
To know if your leaves are showing signs of bleaching, we recommend giving them a tug to determine how strongly they are attached to the stalk. Light burn will bleach the color out of the leaf but will not cause the leaf to easily detach. Rather, the yellow leaf will be firmly attached to the plant. When fertilizer is the culprit, leaves should effortlessly detach from the plant.
Another indicator of light burn is yellowing primarily at the top of the crop where light intensity is the greatest. Yellowing on bottom growth is less likely to be caused by excessive DLI.
If your budding crop is experiencing excess light, it can push the plant’s metabolism into overdrive and cause nutrient deficiencies which generally loosen buds, causing them to be less dense, weak, and have higher air porosity.
Loss of pigment does not only affect leaves. Often buds are bleached as well and lose their color turning white or yellowish. In such cases, growers can expect their final product to be less potent, tasty, and have a shorter shelf life.
What is Too Little Light for Plants?
When plants lack optimal light levels, they lose the ability to photosynthesize at rates necessary to achieve their potential in yield and quality.
The primary result will be slower than expected plant growth and bud development.
Another symptom of low light levels are plants that stretch more than expected to get closer to the light source. Crops that are stretching will have an overall greater height as well as more distance between nodes. Higher internodal spacing generally results in lower overall yields.

About
MORR Inc.
MORR Inc. is a wholesale commercial agriculture distributor for planting, growing, and farming located in Los Angeles, CA. MORR Inc. supplies top of the line wholesale commercial hydroponic systems, commercial grow systems, a wide selection of grow lights and automated control systems, nutrient rich soils and growing media, a large selection of specialized advanced plant nutrients for different plant life cycles, dosing and drip irrigation systems, high tech environmental meters and automated systems, fans, filters, plant pesticides, plant fungicides, automated crop management systems, general commercial grow facility supplies and services, plus much more!
Call- 1-310-967-2022